iNewsDesign
Infographic
Infographic: State of modern creativity
Finally, an infographic that understands. Nod along (and feel vindicated) as you peruse the stats you’ve long felt to be true but never seen proven with cold, hard data. If you’re a creative, this one’s for you. (Read More…)
iStockphoto’s New Plugin for Adobe CS6 Streamlines Designers’ Workflow
Now designers can browse, download and edit photos and illustrations without ever leaving Photoshop, Illustrator or InDesign. The benefits include: A more streamlined workflow Better engagement in the creative process Quick access to images and easy manipulation of those images A smoother overall experience iStockphoto launched an simple and intuitive plugin for several programs in the new … Continue reading
How to create great infographic
Plan early and on time. Gather at the table illustrator, graphic artists, editors and journalists who wrote the theme; sketch on paper how you want your theme to be presented; arrange the details and get to work. Remember – simplicity is the key to success. Be sure to come up with a good headline for … Continue reading
Infographics
When, why and whether to use infographic. The basic fact is that infographic refresh the newspaper, and it contributes to originality of the papers and that is something that nobody can take away from you. But you have to know that there is no good illustrations without good preparation, which in everyday practice is a … Continue reading
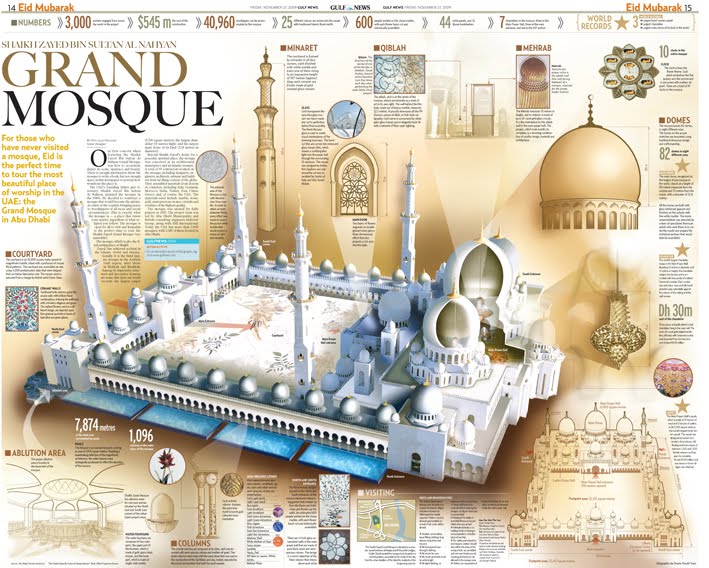
Visual impact: Creative Infographics
More about infographics you can read here.
Infographic: Osama Bin Laden
INFOGRAPHIC: Detailed map of Pakistan and Afghanistan locating available details of the operation which killed Osama bin Laden. (Reuters News Graphics Service) REUTERS: Detailed 3D diagram and map of the bin Laden compound in Abbotabad, Pakistan. Locates available details of the operation which killed Osama bin Laden. (Reuters News Graphics Service) (Click for larger image) Here’s … Continue reading
Cool Infographics
Check this blog:http://www.coolinfographics.com/ About author:Randy Krum President of InfoNewt. Data Visualization, Infographic Design, Visual Thinking, Product Development and Marketing professional fascinated by good infographics. Always looking for better ways to get the point across.
Aston Martin DB10

Production will be strictly limited to 10 of the bespoke sports cars, developed and built by the designers, engineers and highly skilled craftspeople at Aston Martin’s Gaydon headquarters.
Architect Oscar Niemeyer

"My work is not about form follows function, but form follows beauty or, even better, form follows feminine."
BACK to BASICS: Portraits
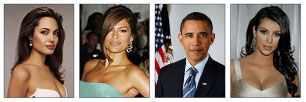
Portraits of people are one of the first elements of the photography used in newspapers.
Typography: x-heigh

In typography, x-heigh refers to the heigh of lower case letters without upper or lower parts when compared to capital letters...
Designer George Lois

“I always knew I was the most talented kid in the school, ” says George Lois of his time at Music and Art. “I was lucky to be exposed to the city’s best art education"...
BODY COPY
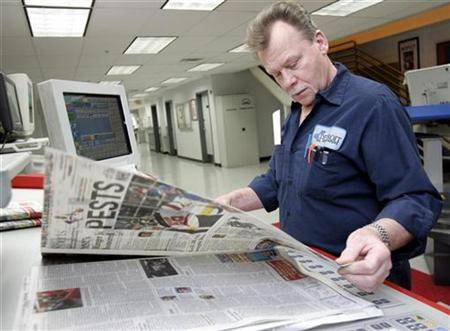
Newspaper typefaces require a higher legibility then typefaces used for other printed products. Newspaper are printed on a paper of lesser quality under high speed.
How to redesign 1

Good redesign is driven by a deep understanding of the editorial mission of the publication.
Headline on photographs

The eternal dilemma! Dilemma of all editors on the planet Earth – to put or not put the headline or any kind of type in the photo.
Design Facts

Three elements that will greatly help you to understand how readers are observing you.
Typeface: NY Times Magazine
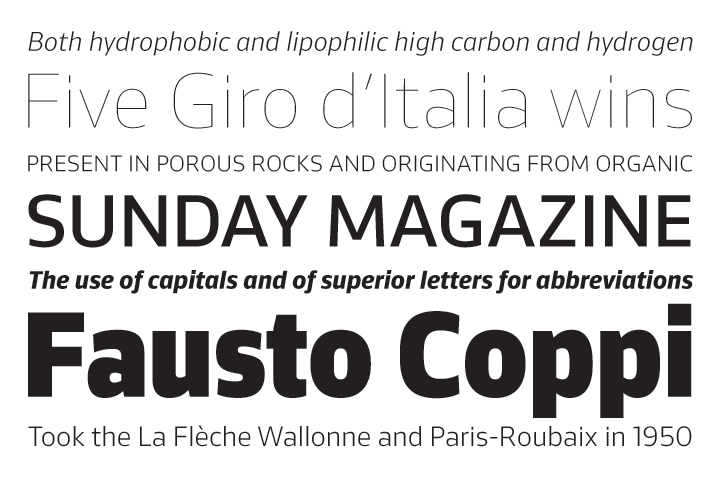
Sunday Magazine is an expansive family of fonts for information in tiny spaces and headlines at large sizes.
Infographics
When, why and whether to use infographic. The basic fact is that infographic refresh the publication, and it contributes to originality of your product.
A well-designed publication

Everything that a well-designed publication must have...
